From the 1st to the 15th of each month, our team is scrambling to ensure we get financials out to our clients because we know the sooner we get the data in their hands, the sooner they have data for solid decision-making. I wonder though, how quickly do our clients open the reports once they receive them? We have a few clients that are always clamoring for the statements as soon as we can get them ready. We have other clients that say, just send them quarterly. And still, others that say they are a bit afraid to even open the document. Maybe we should send a bottle of wine at the same time!
As a business owner myself, I want to see my numbers as soon as they are available. At bookskeep, we have other non-financial metrics that we track for marketing and client satisfaction. Of course, Profit First keeps me in the know with my cash, but there is so much to be learned from the financials. In last week’s blog, we discussed the purposes of the financial statements. This week and next we will dive into a few of the key aspects of your financials.
The Bottom Line
Since I suspect that everyone opens their statements and starts by looking at the bottom line first, let’s go with the flow. What is your Net Profit or Net Income or Operating Profit or EBITDA? They all mean generally the same thing, the bottom line. There is a standard benchmark that successful businesses need to have a net income of roughly 10%. But why be standard when you can do better?! How can you do better? By looking at the numbers that make up that calculation and understanding them, and then committing to improve them by being more efficient, frugal or innovative.
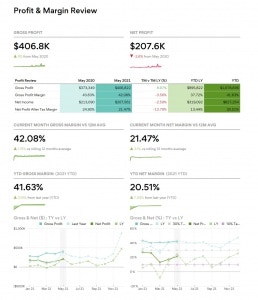
In the report below that we provide with our SmartStatement reports, you can see on the right half of the page the trend of net profit for the month, then compared to the 12-month rolling average, and you can even see the year-to-date numbers. This report allows you to compare this year to the prior year, displayed month by month, and even project future months as well.
The Trends
This type of reporting allows you to see trends. A single data point could mean anything, but what does the trend point toward? For example, I notice a lot of variability in the bottom right graph for last year’s net profit (dashed green line). This year’s numbers (solid green line) look more uniform. What drove that variability and how can it be smoothed out to ensure the maximum net profit going forward? When you compare the net profit (green lines) to the gross margin (blue lines) you will notice that the gross margin is much more consistent. What can we do to move that percentage up since it appears our current cost structure is very steady?
These trends, while typically looking backwards, give you the insights, or at least a plan, to move forward with confidence. Next week, we’ll dive even deeper into understanding your advertising relative to your revenue.
If you have a question about understanding your financials statements, then please let me know. Your question might be featured in an upcoming BUZZ and if it is, I’ll send you a special gift!
Interested in Profit First?

You can also sign up for the Profit First for Ecommerce Sellers Online Course. As a Mastery Level, Certified Profit First Professional, I will teach you why Profit First works so well for ecommerce businesses and the particular challenges for businesses that have physical products requiring inventory management. You will learn how your behavior drives your money management habits for your business and how you can set up your business bank accounts to work with your habits.
Check out all our ecommerce accounting and profit advising services here!
—————————


Leave a Comment