In previous blogs about the Profit First methodology, I’ve talked about setting up your bank accounts for Profit, Owner’s Comp, and Taxes. But how do you know how much to put into these accounts? There’s a formula for that, and taking the Instant Profit Assessment below will help you determine those allocations.
Let’s Get Real with Your Numbers
Profit First has its sunny and positive side, but like anything else, there’s also a reality check. Some entrepreneurs may shy away from confronting the truth about their financial situation. They might sense financial stress and lose sleep over it, yet remain optimistic, believing the problems are temporary. Borrowing money to buy inventory can be a common reaction.
Comparing your business to benchmark numbers of successful companies can reveal the reality and remove the rose-colored glasses. Some entrepreneurs acknowledge the issues but continue on the same path. However, facing the numbers, accepting the facts, and taking action to improve the business requires courage. Ignoring the reality can lead to even more significant challenges down the road.
Completing the Instant Profit Assessment
I’m betting you have that courage and want to tackle the cash-eating monster. To begin, I’m going to show you how to complete your Instant Profit Assessment. Gather these items from your financial records*:
- Balance Sheet from December 2020 to June 30, 2021: Print this out by year. You want to see a column for Dec 2020 and a column for June 2021. If you can export this into an Excel spreadsheet, it will make it easier for you. You need to start with the June 30 account balances and subtract the Dec 31 account balances. The resulting difference will be used in our assessment.
- Profit and Loss Year-to-Date for June 30, 2021: Print this out year-to-date.
*Note: I am assuming a calendar year-end and cash books, or modified cash where inventory purchases hit the balance sheet and entries are made to the P&L for COGS (Cost of Goods Sold). If your fiscal year end is different, you need to adjust the dates so you can compare the prior year end numbers with the last completed month of the current year. Be sure the time period you choose for the P&L and the Balance Sheet is the same.
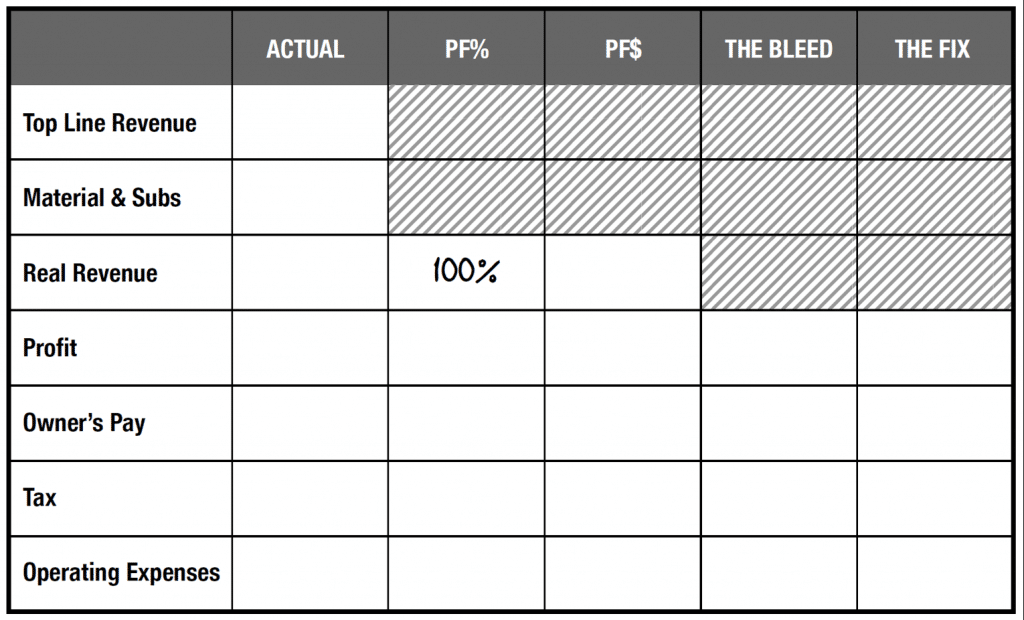
This is the Instant Assessment Form you will be completing:

Here is a description to help you derive each number you will need as you complete the chart.
Top Line Revenue. From Your P&L; it is the total revenue.
Material and Subs (Inventory). From your Balance Sheet worksheet; the difference number for your inventory account between Dec and June. That number will be added to your COGS number on your P&L.
Real Revenue. This is Top Line Revenue minus Material & Subs.
Profit. Look at your Balance Sheet and take the difference number you calculated for your Cash Bank accounts. If you have more money in your bank now than at the end of the year, this will be a positive number; if you have less, this will be a negative number. Then look at your liabilities. What you owe on credit cards, lines of credit, Amazon or Kabbage loans must be considered. Take the difference number you calculated and subtract that from the number you calculated for your bank accounts. This is where it gets hard, because if you pay off your credit cards each month, you may still have a negative Profit account number. I often see people that expect future sales to pay their credit cards. This means they have negative real profit, even though they pay off their credit cards each month and the bottom line on their P&L is positive.
Owner’s Pay. You may find this in the salary number on your P&L or you may find it as an Owner Distribution on the Balance Sheet, or both. If you are taking both, add the difference number you calculated for the Balance Sheet to the salary number from the P&L.
Tax. This is only for State and Federal income taxes – not sales tax or franchise tax; these stay in operating expenses. If you are paying estimated taxes, you should find this on your Balance Sheet. If you are recording estimated taxes on the P&L, use that number.
Operating Expenses. Start with the Expense total from your P&L. Reduce the total by any Owner’s Pay or Taxes that are included in that number.
After you have added all this information into the form, take the Top Line Revenue and subtract Materials and Subs, Profit, Owner’s Pay, Tax and Operating Expenses from that number. You should equal zero or be close. If it doesn’t, then go back and double check your numbers. Specifically look at the Balance Sheet. Did you use the difference calculation? If you used your June year-end number, that will not give you a proper result. Sometimes, there can be an error in the signs when you make your calculations. Also, be sure that every Asset, Liability and Owner Distribution/Contribution account that has changed on the Balance Sheet is represented in your calculations.
The last step is to get your Profit, Owner’s Comp, Tax and Operating Expenses at a Percentage of Real Revenue. Take each number, i.e., Profit and divide it by the Real Revenue number the multiply by 100 to get into a percentage. Profit / Real Revenue * 100 = Profit First Percentage. Add this to your Table.
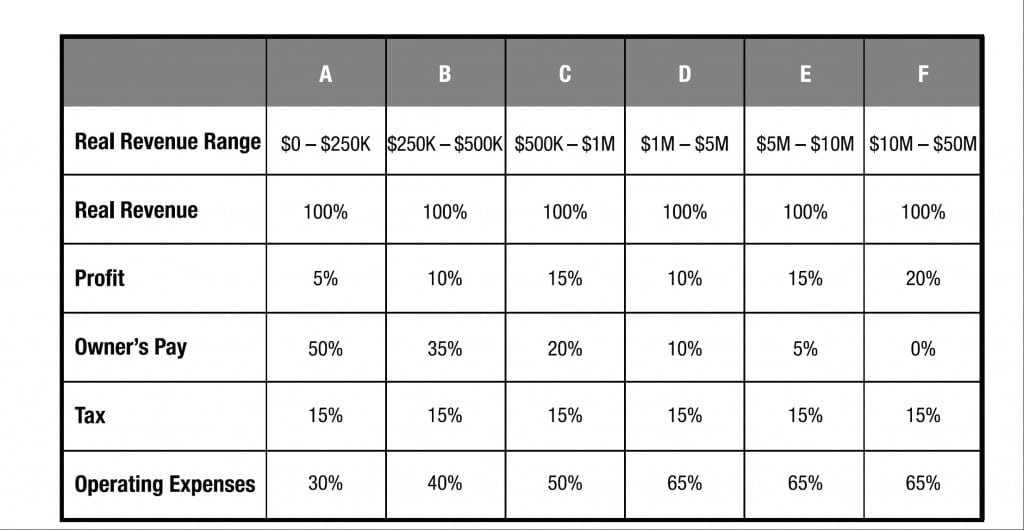
Once you have completed your table you may have some rows left blank. You may not be paying yourself or paying your estimated taxes. Compare your charge with the percentages from a healthy business. Below is the chart that Mike Michalowicz presents in Profit First:

How do you compare? Don’t be discouraged if your numbers don’t look that great. Hang in there. Now you know and you can do something about it. If your situation is more complicated and you just can’t make the numbers work, don’t worry. This is a simple example. Many times, your situation is more complicated. If you get stuck, my book, Profit First for Ecommerce Sellers can guide you. Or reach out to my team at bookskeep.com and we’ll try to help.
Know Where You Stand
Here are a few suggestions on how to improve:
- For now, make sure you have your inventory and your operating expenses in separate bank accounts. If everything else is going to Operating Expenses, then just start putting 1% in your Profit Account.
- If your numbers shape up pretty good, and your cash flow is healthy, then begin funding each of the accounts at the current percentage on your chart and add 2% to your Profit account. Reduce your Operating Expense account by the 2%. Watch your accounts closely at first. As with any new system, it may take some dialing in.
I like using this Instant Assessment for giving you a quick, 50,000-foot view. For a ground-level view, I recommend doing a monthly assessment in a similar way. It will get you closer to getting real with your numbers.


Leave a Comment